Booking Pace Analysis: Step-by-Step Guide

Table of Contents
- Overview — Main Idea
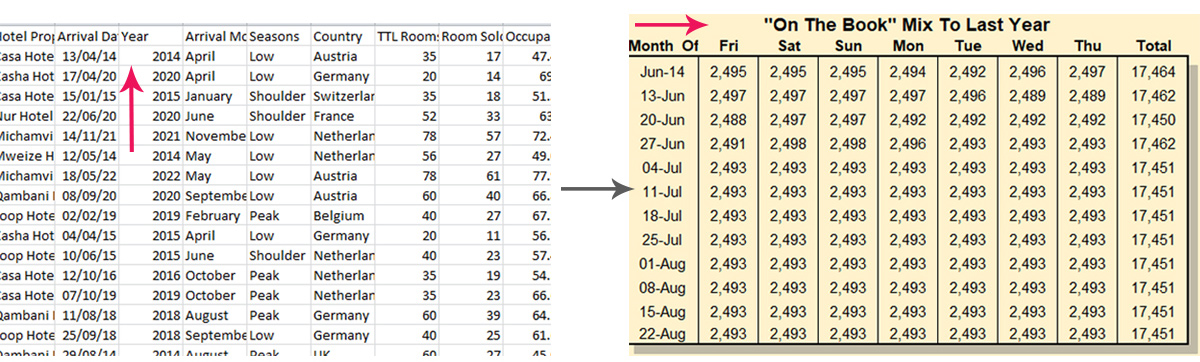
- Source Table & Key Fields
- Realized Demand vs. Last Year
- On the Books – Transient Rate Type
- Transient Pace to Projection Tool
- Where to Find in Opera PMS
- OTB vs LY – Checked-In/Out?
- Metrics Explained
- Practical Steps (SQL & Excel)
- Final Output: Weekly Pivot
- Sample SQL & Pivots
- Closing Notes & Workflow
Introduction
This guide explains how to analyze hotel Booking Pace using data exported from Opera PMS (Property Management System) and tools such as SQL, Excel, and Tableau. It covers what each metric means, where to find it in Opera or your extracted dataset, how to substitute missing metrics, and how to pivot arrival dates into a weekly Booking Pace matrix (Friday → Thursday).
Overview — Main Idea
Booking Pace tracks how room nights build over time. In Opera, reservations, status updates, and night audits can give you an accurate view. The workflow is:
- Export reservations and night audit data from Opera for a rolling window (e.g., 90 days back and forward).
- Summarize by arrival date: rooms sold, occupancy, ADR (Average Daily Rate), revenue, channel, and segment.
- Compare current On The Books (OTB) to the same days-out last year and prior periods.
- Pivot daily arrivals into a Friday-to-Thursday matrix to see trends easily.
Source Table & Key Fields
From Opera, export reservation and stay data. Useful columns include:
hotel_id | hotel_name | arrival_date | departure_date | booking_date | status | market_segment | rate_code | distribution_channel | total_rooms | rooms_sold | ADR | revenue
Add fields like reservation_id, folio_post_date, room_nights, occupancy_flag for precision.
Realized Demand vs. Last Year
Opera PMS can show realized nights via Night Audit or Stay View:
- Definition: Room nights actually consumed. Opera often counts them at checkout but can be configured to count at check-in.
- Variants:
- Night Audit count (preferred)
- Checked-in/checked-out stays
- Revenue postings by date
- If missing: Use night audit or folio postings. If not available, approximate: count stays where arrival_date ≤ date ≤ departure_date and status = 'IN-HOUSE' or 'CHECKED-OUT'.
Realized Demand vs. Last Year
To compare against Last Year (LY), line up your historical data day-by-day or week-by-week to see if your demand is trending higher, lower, or about the same. This becomes your baseline for performance reviews and forecasting
On the Books – Transient Rate Type
On the Books – Transient Rate Type
Breaking it down by transient rate types (individual travelers rather than groups) is crucial because this segment tends to book closer to arrival and drives rate-sensitive revenue. By looking at the next 30, 60, or 90 days, you can see how fast your occupancy is building and whether you are pacing ahead or behind your goals.
In simple terms, OTB tells you: How much business do I have today for dates in the future, and at what rates?
On the Books in Opera is a snapshot of confirmed future reservations. To isolate transient pace (non-group):
- Filter reservations where status = 'RESERVED', 'CONFIRMED', or 'GUARANTEED'.
- Exclude group blocks or wholesale rates if needed.
- Capture OTB snapshots regularly (daily or weekly) for comparison.
Transient Pace to Projection Tool
This
concept is about looking forward, not just backward.
- Where do you find it? In Opera or Fieldio PMS,
it’s usually a combination of booking reports, pickup reports, and
forecast modules. You can also export raw data and build your own
views in Excel, SQL, or Tableau.
- What is Projection? Projection is your best
estimate of what will happen by arrival date if current booking patterns
continue.
- How is it different from
Forecasting?
Forecasting often uses broader data (market trends, events, weather,
competitor analysis), while projection is more tactical and focused on if
nothing changes, where will we land based on current pace?
This combines:
- Opera exports (reservations, night audit)
- Projections (budget or Long Range Plan)
- Historic OTB snapshots
It answers: Are we pacing ahead or behind target? Opera’s Reports module can give daily OTB; export to Excel or Tableau to build pace charts.
Why does
it matter?
It lets you answer questions like:
- Are we ahead or behind last
year?
- Are we building enough
pickup to hit targets?
- Which rate types are helping
or hurting?
Where to Find in Opera PMS
In Opera:
- Realized: Night Audit > Room Statistics or Folio Transactions report.
- OTB: Reservation Summary or Availability by Date report.
- Historical OTB: Save daily reports manually or automate extracts.
- Projection: Usually outside Opera (budget files) but can be uploaded for BI comparison.
OTB vs LY – Checked-In/Out?
Opera’s OTB reports normally exclude checked-in rooms for future dates. For analysis:
- Use pure OTB (future dates only).
- Use night audit realized for historicals.
- If combining in-house + OTB, label clearly.
Metrics Explained
- Current OY Realized Demand
vs. LY:
Compare this year’s actuals with LY at the same points to track growth or
decline.
- Current OTB Rate: The average daily rate of
bookings already secured.
- Last Week’s OTB Rate & 1
PD Ago OTB Rate:
Shows how your rates are moving week over week or period over period.
- OTB Variance to LY and 1
Period Ago:
Are you pacing ahead or behind compared to last year and your own recent
performance?
- Pickup Variance: How many more rooms do you
need to sell to match LY or to stay on track with your projection?
- Segment ADR & Mix
Percentages:
Which segments are paying more or less, and how is your business mix
shaping up?
- Price Sensitivity &
Additional Demand: Are you losing bookings because your rates
are too high, or is there more demand to capture?
Each metric (Realized vs LY, OTB rate, pickup variances, mix percentages, ADR by segment, etc.) is detailed in this section. They align with Opera’s data points like Reservation Status, Room Nights, and Revenue Codes.
Practical Steps (SQL & Excel)
Includes:
- Extract reservations & night audit tables.
- Aggregate realized demand (rooms, ADR).
- Snapshot OTB daily or weekly.
- Join on arrival_date, compute days_out.
- Pivot in Excel or SQL to Fri→Thu.
Final Output: Weekly Pivot
Example: Week rows, Fri–Thu columns, Total column. Useful for leadership and revenue teams.
Sample SQL & Pivots
SELECT
  arrival_date,
  (arrival_date - ((EXTRACT(DOW FROM arrival_date)::int - 5 + 7) % 7) * INTERVAL '1 day')::date AS week_of_fri
FROM reservations;
More examples included: aggregating rooms sold, ADR, and revenue.
Closing Notes & Workflow
- Define realized demand clearly; document assumptions.
- Snapshot OTB consistently and persist it.
- Automate exports from Opera to warehouse or BI.
- Pivot and visualize weekly pace for quick insights.