
-->
Showing posts with label Data Analysis. Show all posts

Booking Pace Analysis: Step-by-Step Guide

Home


    Booking Pace Analysis: Step-by-Step Guide

    Booking Pace Analysis: Step-by-Step Guide


    Table of Contents

    Introduction

    This guide explains how to analyze hotel Booking Pace using data exported from Opera PMS (Property Management System) and tools such as SQL, Excel, and Tableau. It covers what each metric means, where to find it in Opera or your extracted dataset, how to substitute missing metrics, and how to pivot arrival dates into a weekly Booking Pace matrix (Friday → Thursday).

    Overview — Main Idea

    Booking Pace tracks how room nights build over time. In Opera, reservations, status updates, and night audits can give you an accurate view. The workflow is:

    1. Export reservations and night audit data from Opera for a rolling window (e.g., 90 days back and forward).
    2. Summarize by arrival date: rooms sold, occupancy, ADR (Average Daily Rate), revenue, channel, and segment.
    3. Compare current On The Books (OTB) to the same days-out last year and prior periods.
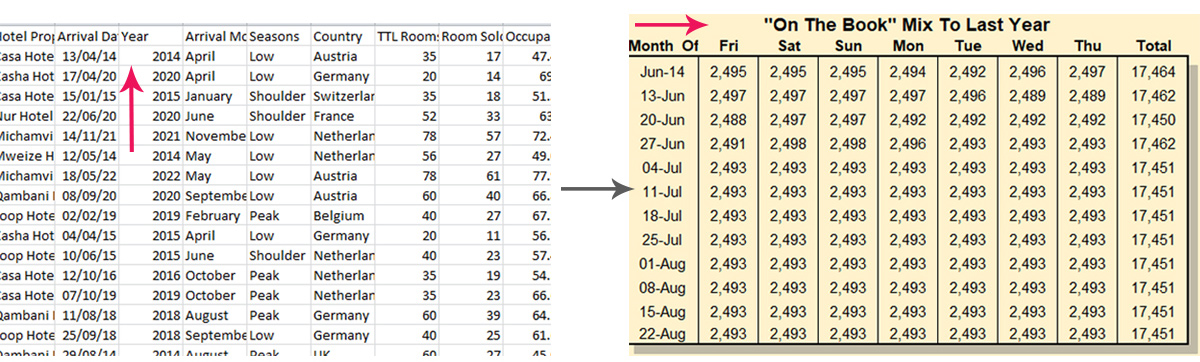
    4. Pivot daily arrivals into a Friday-to-Thursday matrix to see trends easily.

    Source Table & Key Fields

    From Opera, export reservation and stay data. Useful columns include:

    hotel_id | hotel_name | arrival_date | departure_date | booking_date | status | market_segment | rate_code | distribution_channel | total_rooms | rooms_sold | ADR | revenue

    Add fields like reservation_id, folio_post_date, room_nights, occupancy_flag for precision.

    Realized Demand vs. Last Year

    Opera PMS can show realized nights via Night Audit or Stay View:

    • Definition: Room nights actually consumed. Opera often counts them at checkout but can be configured to count at check-in.
    • Variants:
      • Night Audit count (preferred)
      • Checked-in/checked-out stays
      • Revenue postings by date
    • If missing: Use night audit or folio postings. If not available, approximate: count stays where arrival_date ≤ date ≤ departure_date and status = 'IN-HOUSE' or 'CHECKED-OUT'.

    Realized Demand vs. Last Year


    When we talk about Realized Demand, we mean the actual rooms consumed—stays that have already happened. Depending on your property, this could mean checked-in rooms, checked-out rooms, or both (most hotels use checked-out data for historical reporting). This metric gives you a true picture of what business you actually captured, rather than what was on the books.
    To compare against Last Year (LY), line up your historical data day-by-day or week-by-week to see if your demand is trending higher, lower, or about the same. This becomes your baseline for performance reviews and forecasting

    Read More about  Future Demand and Supply

    On the Books – Transient Rate Type

    On the Books – Transient Rate Type

    On the Books (OTB) means everything currently reserved for future dates. This includes all confirmed bookings sitting in your PMS but not yet realized.
    Breaking it down by transient rate types (individual travelers rather than groups) is crucial because this segment tends to book closer to arrival and drives rate-sensitive revenue. By looking at the next 30, 60, or 90 days, you can see how fast your occupancy is building and whether you are pacing ahead or behind your goals.
    In simple terms, OTB tells you: How much business do I have today for dates in the future, and at what rates?

    On the Books in Opera is a snapshot of confirmed future reservations. To isolate transient pace (non-group):

    • Filter reservations where status = 'RESERVED', 'CONFIRMED', or 'GUARANTEED'.
    • Exclude group blocks or wholesale rates if needed.
    • Capture OTB snapshots regularly (daily or weekly) for comparison.

    Transient Pace to Projection Tool

    This concept is about looking forward, not just backward.

    • Where do you find it? In Opera or Fieldio PMS, it’s usually a combination of booking reports, pickup reports, and forecast modules. You can also export raw data and build your own views in Excel, SQL, or Tableau.
    • What is Projection? Projection is your best estimate of what will happen by arrival date if current booking patterns continue.
    • How is it different from Forecasting? Forecasting often uses broader data (market trends, events, weather, competitor analysis), while projection is more tactical and focused on if nothing changes, where will we land based on current pace?

    This combines:

    • Opera exports (reservations, night audit)
    • Projections (budget or Long Range Plan)
    • Historic OTB snapshots

    It answers: Are we pacing ahead or behind target? Opera’s Reports module can give daily OTB; export to Excel or Tableau to build pace charts.

    Why does it matter?
    It lets you answer questions like:

    • Are we ahead or behind last year?
    • Are we building enough pickup to hit targets?
    • Which rate types are helping or hurting?

    Where to Find in Opera PMS

    In Opera:

    • Realized: Night Audit > Room Statistics or Folio Transactions report.
    • OTB: Reservation Summary or Availability by Date report.
    • Historical OTB: Save daily reports manually or automate extracts.
    • Projection: Usually outside Opera (budget files) but can be uploaded for BI comparison.

    OTB vs LY – Checked-In/Out?

    Opera’s OTB reports normally exclude checked-in rooms for future dates. For analysis:

    • Use pure OTB (future dates only).
    • Use night audit realized for historicals.
    • If combining in-house + OTB, label clearly.

    Metrics Explained

    • Current OY Realized Demand vs. LY: Compare this year’s actuals with LY at the same points to track growth or decline.
    • Current OTB Rate: The average daily rate of bookings already secured.
    • Last Week’s OTB Rate & 1 PD Ago OTB Rate: Shows how your rates are moving week over week or period over period.
    • OTB Variance to LY and 1 Period Ago: Are you pacing ahead or behind compared to last year and your own recent performance?
    • Pickup Variance: How many more rooms do you need to sell to match LY or to stay on track with your projection?
    • Segment ADR & Mix Percentages: Which segments are paying more or less, and how is your business mix shaping up?
    • Price Sensitivity & Additional Demand: Are you losing bookings because your rates are too high, or is there more demand to capture?

    Each metric (Realized vs LY, OTB rate, pickup variances, mix percentages, ADR by segment, etc.) is detailed in this section. They align with Opera’s data points like Reservation Status, Room Nights, and Revenue Codes.

    Practical Steps (SQL & Excel)

    Includes:

    1. Extract reservations & night audit tables.
    2. Aggregate realized demand (rooms, ADR).
    3. Snapshot OTB daily or weekly.
    4. Join on arrival_date, compute days_out.
    5. Pivot in Excel or SQL to Fri→Thu.

    Final Output: Weekly Pivot

    Example: Week rows, Fri–Thu columns, Total column. Useful for leadership and revenue teams.

    Sample SQL & Pivots
    Sample SQL & Pivots


    SELECT
      arrival_date,
      (arrival_date - ((EXTRACT(DOW FROM arrival_date)::int - 5 + 7) % 7) * INTERVAL '1 day')::date AS week_of_fri
    FROM reservations;
      

    More examples included: aggregating rooms sold, ADR, and revenue.

    Closing Notes & Workflow

    • Define realized demand clearly; document assumptions.
    • Snapshot OTB consistently and persist it.
    • Automate exports from Opera to warehouse or BI.
    • Pivot and visualize weekly pace for quick insights.
    Share:

    Hotel Performance

    Home

    Hotel Performance :

    How can you develop knowledge about the hospitality industry?

    Storytelling can create unique events and has the power to inspire guests emotionally and retain them. Storytelling is the hospitality skill of the future.

    besides data analytics, organizations can optimize prices based on market demand. For example, by correlating seasonal trends with market data

    By analyzing financial data, businesses can identify areas w they can reduce costs or increase revenue

    In addition Hotels can analyze market data, demand forecasts, and competitor pricing to optimize their pricing strategies. By identifying pricing gaps and

    Predictive analytics empowers hotels to make data-driven decisions in revenue management and labor management. By accurately forecasting demand

    Moreover Hotel Booking Insights Data Analytics Project – Tutorial!

    Calculate the year-over-year changes in revenue for both hotels, dividing revenue streams by season. .. analysis on Seasonal revenue

    What do KPI dashboards include?

    Every analytics platform is different, but typically modern KPI dashboards can make use of a wide range of different data visualizations and KPI categories, including conversion rate, revenue growth, churn rate, budget threshold, net profit, share-of-voice (SoV), etc.

    Metrics such as the revenue per available room (RevPAR), the average daily rate (ADR) or the average occupancy rate (OCC) can be used to measure sales performance. The market penetration index (MPI) and the revenue generated index (RGI) can help evaluate how a is performing on the market.

    One of the most important KPIs for hotel managers is revenue per available room, or RevPAR. This metric takes into account the average daily rate of a room (ADR) and the occupancy rate to give you an idea of how much money your hotel is making per day

    An informational and resourceful page for all hoteliers

    Hotel Performance Simple Dashboard

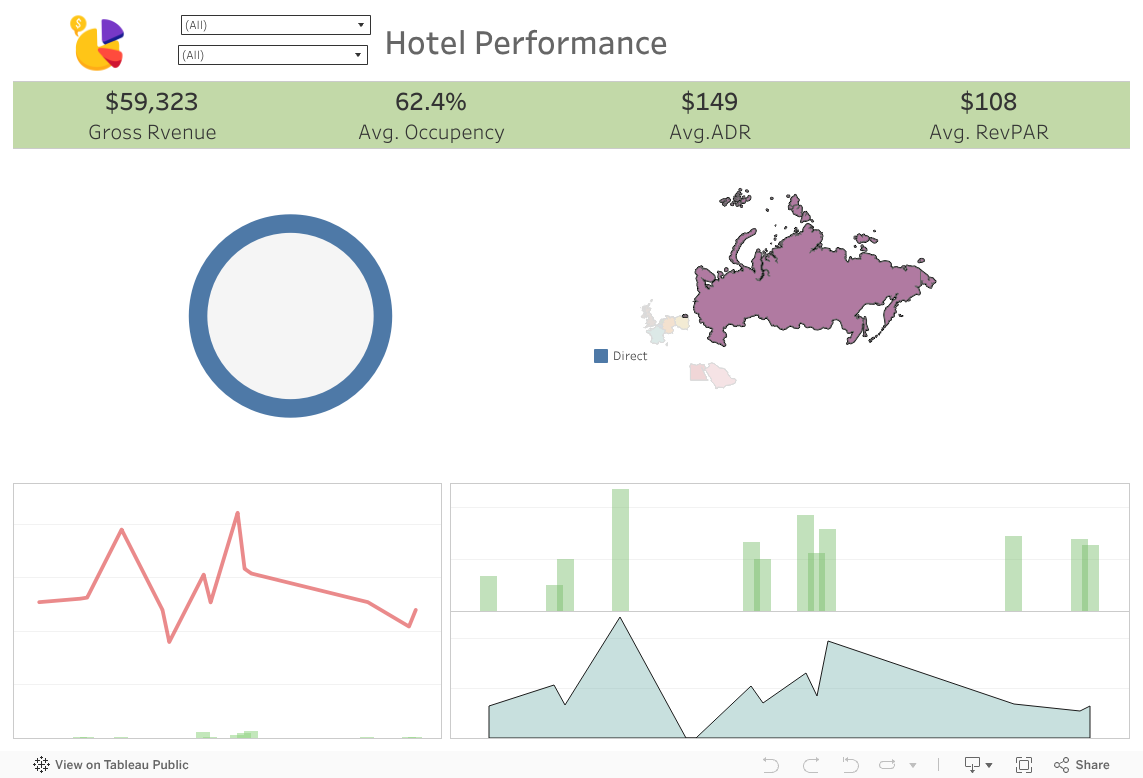
    No calculation just adding ADR, Occupancy, RevPAR, Properties, and Arrival Dates, and dashboard is created

    other projects on Tableau Public

    <--------------here------------------>


    Finally Keep Reading

    Furthermore above KPI calculation when can calculate Price Sensitivity
    What’s more can be achieved with Tableau

    • Booking Pace
    • Accurate Segmentation
    • Benchmark Room Rate
    • Establishing Citywide Room Rate
    • Business Opportunity & Displacement
    • Segment Forecasting Tools
    • Which Accurate Segmentation
    • Calculating Additional Demand
    • Maximize Revenue by Selling the Right Rate
    • Seasonality
    Share:

    Tableau Project


    Tableau Project

    Tableau Project – Master Tableau in Minutes: 

    A Comprehensive Intro to Interface, Data Connections & More!”

    “Unlock the power of Tableau with this easy-to-follow video tutorial! We’ll guide you through the essentials of the Tableau interface, teach you how to connect to various data sources, and demonstrate how to upload and work with CSV files.

    Plus, you’ll get hands-on experience with the toolbar, left, and right panels to create stunning visualizations in no time. Join us on this exciting journey and elevate your data analysis skills to new heights! Subscribe now and stay tuned for more Tableau tips and tricks!”

    Tableau Project / Data Visualization


    Tableau Introduction

    Our First Project we will use XYZ Hotel Group CSV file data source and analyse it.
    When you open tableau may be your first time opening tableau.
    I’m just going to give you a quick tour

    Left Pan

    Generally where you can connect to different data sources the good thing about tableau there are a lot of varieties in terms of connecting to different data sources

    Connect Data

    You can connect two tableau server that is tableau’s product it’s their own server where you can publish reports directly.

    You can also connect to static files such as Microsoft Excel text files Jason files.
    You can connect to cloud servers as well so you Amazon, Maria DB, azure.
    We are going to connect to a cloud server in the third project and that’s important because as a data analyst.

    It is important to know how to connect to cloud servers on tableau and it’s very simple.
    Finally you should have some saved data sources this is straight from tableau itself.

    Interface

    This big white space here generally if you have worked on workbooks they show up here sort of like a recent files window.
    Below is some sample workbooks that tableau have available for you and these workbooks are laid out.
    On the right is always some training resources.
    It’s getting started with tableau connecting to your data free resources that you can have a look at and some more resources as well
    Now that we are a bit more acquainted with the tableau let us connect to Our Data source.
    So remember the data source is a CSV which is actually a text file so it says two a file and text file.

    Tableau Project / Data Analysis

    I want you to click it and once you do navigate to wherever you store your data.
    So I started in a folder called XYZ Hotel Group and you can see XYZ Hotel CSV File.

    we will analysis Room Rates, Occupancy, ADR, Room Night Sold
    Click open okay so as you can see now we are in the different window to the previous one this is often known as the data source window.

    You can see on the bottom left.
    It says data associated & this just shows you more information on the data source that you just connected to.

    Let’s have a bit of a tool of this window.
    So on your left as you can see this is the connections part and it shows you what data sources.

    You can connect to more than one data source.

    Tableau Project / Tableau Tips

    Now it’s just one file so if you click on this little arrow here you can edit the connection.
    So this is where if maybe you made a mistake or you want a new updated file.
    You can do it here you can also rename your data source so instead of XYZ Hotel CSV file margin call it whatever but I’m just going to leave it.

    I’m clicking out of it this section usually shows the tables within your data source.
    So because we had one sheet which is called XYZ Hotel CSV it’s only showing us one, and use data interpreter.
    data interpreter this basically cleans your text file Workbook what it does is that if it sees something like merged rows etc.…
    It gets rid of them and puts it in a more better table format.
    So if you do click it shouldn’t actually do anything just because you can see this table is pretty clean.

    It would help if maybe someone merged these two rows together, and called them something else.
    in the text document it would have leaned it but this table is looking fine.
    So we don’t need to use data interpreter.

    Union so Union is just a function that allows you to append data into your table.
    If you had two text files which you different years that are exactly the same, but just two different years.
    You can create a new Union and what it does is that it would have appended the two sheets moving on to the main window
    As you can see when we connect it at immediately brought in the sheet into this pan if we had other connections.
    We could have just dragged it and dropped it and it would have brought it into this paint.
    As well again opportunity for you to change your title of your database if you want okay so let’s move downwards so you can.
    See there’s two icons here, and one just represents a little preview of the table, and if you click on this icon here this is just a summary of the field name and the table it is from.
    Let’s go back to the table icon where it says sort Fields you have the opportunity of sorting out each of these fields into maybe alphabetical order etc.…


    Which I generally do just because it’s easier to store through so it tastes thought.
    Fields click on it now data source ordered just means how it appears on your actual data source, and we’re going to switch it to something called A to Z ascending per table.


    Now it’s in alphabetical order.
    Next thing we should do is let’s just go through the data while we here, and before we do that.
    I want you to take note of the format of each field so you can see the field name is here and the table it’s from is here and on the top of every field. See Video Here

    Tableau Project

    You see it has some icon and this icon represents the field type.
    For instance category is a bunch of words or letters, and in data language.
    It’s called a string so tableau automatically classifies field types, and you can see.
    If you click on ABC string is selected the next column as you can see is Hotel as String.
    Other Data format we will work on it as we go.
     looking at this data I think we have enough to do an analysis for Mr XYZ Hotel, and I think it would be sufficient okay so moving on.

    Tableau Project

    If we go to the top right we can see a pain called connection and live or extract.
    What is the difference basically what have low is saying is that how you want your data connected.
    Do you want it live so why are you build the dashboard.
    If there is any data coming in, and you want it automatically updated.
    Or do you want an extract.
    I’ll go into extract into a bit more detail soon I just want to talk a bit more about live.
    The live connection is basically where your data source contains a direct connection to your underlying data now.

    Tableau Project

    Note that this year is a text file it’s not getting updated it’s on your local computer.
    We don’t necessarily need a live connection, but in a case we do need a live connection remember.
    When you do connect live it’s not always best for your dashboard it’s not optimized for fast performance as you building your dashboard.
    Remember Tableau is also concentrating on getting live data into your dashboard.
    It definitely slows the process, and I’ve worked on live databases before where I had to build dashboards.
    And often are not at too slow it’s very frustrating.
    If you are choosing live I think always also question does it need to be live is this somebody who’s gonna monitor this dashboard 24/7.
    Or can you think of a better data workflow all right so that brings us to the next option which is extract and this is definitely my go-to.

    Tableau Project

    Extracts are snapshots of data which are optimized for tableau their optimized for data aggregation as well.
    These snapshots are actually loaded into tableau’s memory to be quickly recalled for the visualization.
    It definitely makes your Workbook faster when you build your dashboards.
    I do recommend them the good thing is also remember if it’s an extract you can actually connect to it offline.
    So once you develop the extract it gets saved to your local computer and you can bold your dashboard like that without an internet connection.
    Whereas live doesn’t require that if you don’t have an internet connection or if you have post signal you won’t be able to bold the dashboard.
    It’s definitely good practice to get into the Habit of letting an extract and less you really needed live the next thing.

    Tableau Project

    want to talk about is the filters.
    On top here so what this does is that it can filter your data source and this is useful if you only want to make an analysis based on a certain set of data.
    Maybe you want to build a dashboard on a specific year of data you can use the filters here.
    Now using the filters on this window so in your data source pain if you use a filter here you can’t build a dashboard on the data that you faulted out.
    So if you just want to see 2018 data and you create a filter here you will not bold your dashboard on any other year other than the year of 2018.
    I just want to show you how to do photos quickly because it’s quite important so click on add and let’s say we want to filter on maybe a Hotel let’s do a Hotel.
    Let’s only bring in Hotel CDM so click add and the field we are looking at is some Numbers of Data extracted.
    Click ok and I just want to see Hotel CDM.
    I’m just going to search on this text and Hotel CDM pops up so selected and we can see we selected one value out of total Numbers of Data extracted.
    Click okay and you can see now this changes so it says that there’s a Hotel filter and the details are it’s only keeping Hotel CDM.
    Click okay and now you can see that only Hotel CDM will appear in your data set okay now.
    I actually want to do an analysis on the whole data set.
    I’m not going to do a photo here so let’s remove it to do that click on edit on the top right click on the study filter and .
    Click remove click okay  now we are back to normal okay I think we’ve done. See Video Here
    Also check out
    Share:

    Simple STR Reporting in Tableau

    str report


    Simple STR Reporting in Tableau.

    Understanding how to manipulate, and visualize this data is crucial for making informed business decisions.

    What is a STR Report?

    STR (Smith Travel Research) report provides critical performance data for the hospitality industry.

    These reports can be Imported to your PC in various formats, including PDF, CSV, or Excel sheets.

    Sections of the STR Report "this is Excel forma version"

    1) Table of Contents Page

    Just introduction page with STR company Information, and hyper links to navigate the report, also you have tabs for each sheet named accordingly

    STR report

    Second Page

    YTD and Year
    this section divided into 4 parts under each other

    STR Report

    STR Report

    YTD and Year Sections of the STR Report

    STR Report

    The report is divided into two main sections:

    Group 1: Your hotel property

    Group 2: Selected properties (competitors)

    Sheets in the Workbook

    When you export the report, it will include multiple sheets, such as:

    Table of Contents

    STR Report

    Worksheets Tabs

    YTD and Year

    By Month

    % Change

    Moving Avg.

    Day of Week

    These sheets compare “Group 1” (your hotel) against “Group 2” (selected properties or competitors). Both groups are displayed under the same columns, so we need to separate them.

    STR Report

    Step 2: Reshaping the Data

    To analyze the data effectively in Tableau, you need to reshape it. There are two ways to achieve this:

    Method 1: Manual Data Table Creation

    Understand the Structure: The first two rows in the report contain merged cells across columns A to I.


    Unmerge and Add Colum

    n Names: Copy the column names and add them to each group as needed.

    Separate Data by Groups:

    Ensure data for Group 1 and Group 2 are in distinct columns.

    Reshaped Data

    Excel Rshaping


    Share:

    Data Analysis for Hotel Revenue

    Data Analysis for Hotel Revenue


    Data Analyses for Revenue Analyst, you will analyze hotel data and present strategies and forecasts that will help the hotel stay ahead of the competition.

    A Revenue Analyst will support the Revenue and Sales Teams by providing information and strategies to maximize sales efforts

    Share: